


- Energy
Categories:
For the first time in history, in 2023, renewable energy in Spain exceeded 50% of annual generation. The Spanish generating park’s installed capacity increased by 5.2%, ending 2023 with 125,620 MW. The installed renewable energy capacity in the national electricity system has increased by 6.3 GW, which has allowed reaching an installed capacity from renewable generation sources of 61.3% of the total installed capacity.
The end of 2022 was impacted by the war in Ukraine, high inflation and the saving measures that led demand on a downward path. This trend continued in 2023, even more so due to the demand for electricity in Spain dropping 2.3%, when compared to the previous year. The demand for electricity in Spain reached a total of 244 TWh, the lowest value since 2007. But not only demand declined, electricity generation also dropped in 2023 by 3.5% with respect to the previous year, following two consecutive years of growth, 3.4% in 2021 and 6.3% in 2022.
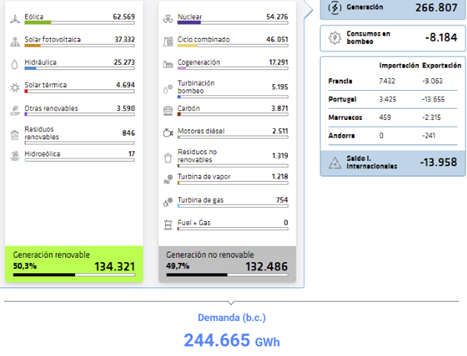
Image 1.- Electricity balance of the Spanish national system (Source: Informe del sistema eléctrico de 2023″- Red Eléctrica)
But today’s analysis will focus on solar energy, in fact, the installed photovoltaic solar power increased by 28% in 2023, with 5,594 new MW added to the Spanish generating park, the largest figure since records are available. This technology now has 25,549 MW in service and covers 20.3% of the total structure of the Spanish generating park. As a result of this year-on-year increase, Spain is the second country with the highest installed solar capacity (both thermal and photovoltaic) in the ENTSO-E countries. Surprisingly, as can be seen in the following infographic, the European country with the highest installed renewable capacity is Germany.
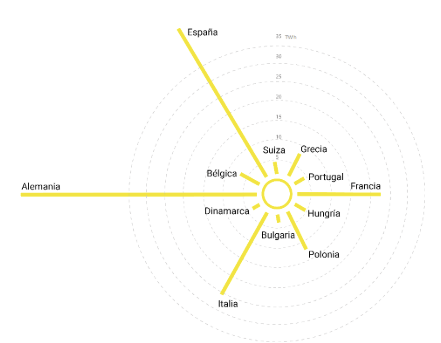
Image 2.- Infographic representing the wind and solar energy generated in Europe (2023) (Source: Red Eléctrica)
The following table shows the growth of wind and solar power of the country’s autonomous communities. Solar power has registered the largest increase. The installed renewable energy capacity in the national electricity system has increased by 6.3 GW, which has allowed reaching an installed capacity from renewable generation sources of 61.3% of the total installed capacity.
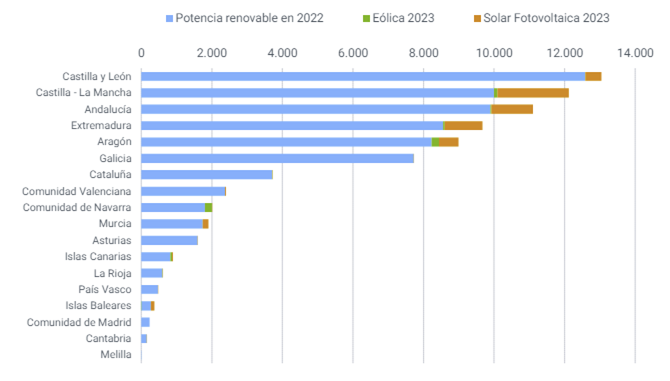
Image 3.- Increase in renewable power segregated by autonomous communities in Spain (2023) (Source: Red Eléctrica)
As for the generation balance by type of energy, the generation of renewable energy in the national electricity system increased by 15.1% in 2023, with a record in production of 134,321 GWh. This increase was mainly due to the increased production of solar and hydraulic power, which grew by 41.1% and 33.8%, respectively. In 2023, the share of renewable production in the national mix was the largest for the first time in history, with a 50.3% share versus 42.2% in 2022.
Obviously, the renewable energy capacity installed in Spain is reaching a point where the system is oversized in certain hours and is therefore leading to renewable electricity prices of €0/MWh in the daily market. The following image shows the daily market price for the first half of 2024.
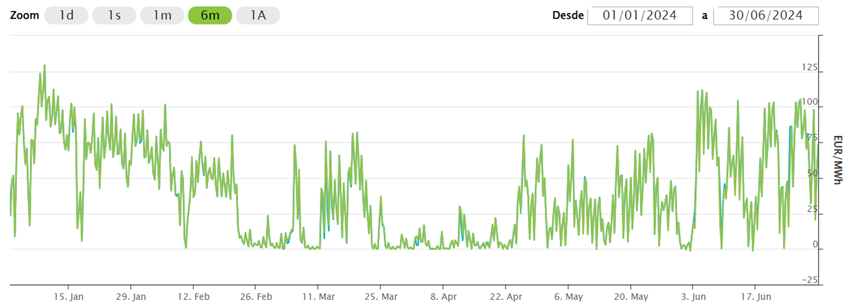
Image 4.- Daily market price of electricity (1st half of 2024) (Source: OMIE)
The following image, taken from the OMIE’s public data as at 24 June 2024, shows the daily marginal price of the Iberian market’s electricity, where Spain and Portugal combined mobilised 541.6 GWh. As regards Spain, the arithmetic mean of marginal prices was €41.15/MWh. However, during the central hours of the day, between 12:00 and 18:00, the cost was less than €5/MWh.
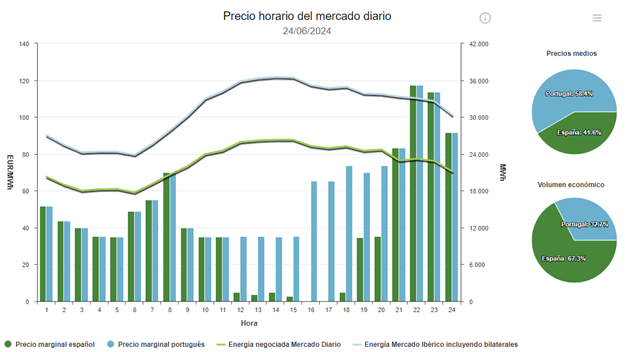
Image 5.- Daily market price of electricity (as at 24 June 2024) (Source: OMIE)
So, when you install a photovoltaic farm, what should you do to increase its economic performance? Firstly, if an energy purchase agreement were established outside the OMIE market, there would be no issue.
But what if the PV plant wants to sell to the market?
The alternative would be to optimise the hours when electricity is more expensive, with the aim of increasing its income. To that end, the park’s owner would have to increase production at the beginning of the day and at sunset.
When the sun rises from and sets on the horizon, it has a lower angle, making it the critical point for the photovoltaic farm. If you are wondering why, it is simple: when the sun is at the highest point in the sky, that is, during the central hours of the day, the radiation received by the panels is high, thus generating their maximum capacity. However, when the sun’s position is lower, the challenges of maintaining production at the highest level increase.
Sener has a tool that optimises the panel’s orientation with a 3D approach and manages to maximise production results. This context is associated with two analyses that I will conduct on how to optimise the installation of a photovoltaic farm to obtain the lowest levelised cost of electricity.
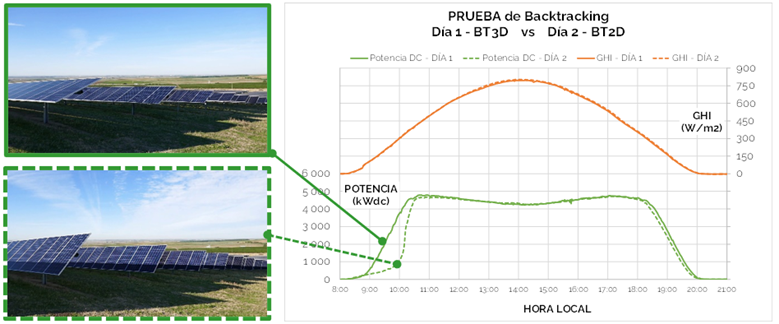
Image 6.- Actual impact of ORUGA® software on the increase in morning production (Source: Sener)
The image shows a commercial plant originally operating with 2D or Flat Backtracking. The undulations of the terrain create abundant shadows between rows, producing electrical losses. These losses evolve throughout the morning depending on the operating conditions at any given time. As you can observe in the previous image, when implementing 3D Backtracking, the shadow generated on the solar panels is minimised, resulting in a substantial increase in electricity production.
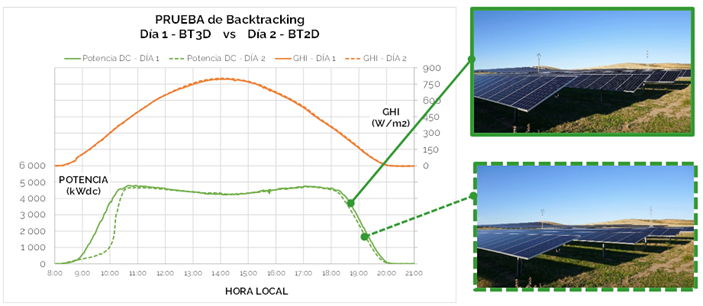
Image 7.- Actual impact of ORUGA® software on the increase in late-afternoon production (Source: Sener)
The following charts show a minutely comparison between a real-life situation and a simulation of the ORUGA® Performance Model for a whole day in two different commercial plants (left: Spain, right: Brazil). It can be clearly seen that, even in cloudy periods, the difference between the plant’s measurement and the simulation is contained. This allows accurately predicting the plant’s performance with and without 3D Backtracking:
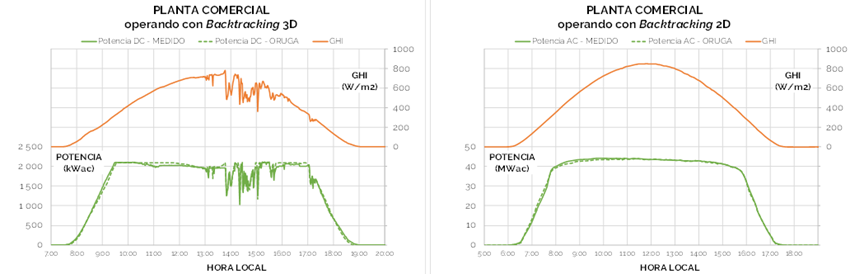
Image 8.- Minutely comparison between a real-life situation and simulation of the ORUGA® Performance Model (Source: Sener)
Usually, these things do not arise from nowhere. The ORUGA® Performance Model software is based on the lessons learned from tower concentration projects, such as Gemasolar (Spain, 19.9 MW) and Noor III (Morocco, 150 MW), which feature advanced Sener proprietary control and process technologies.
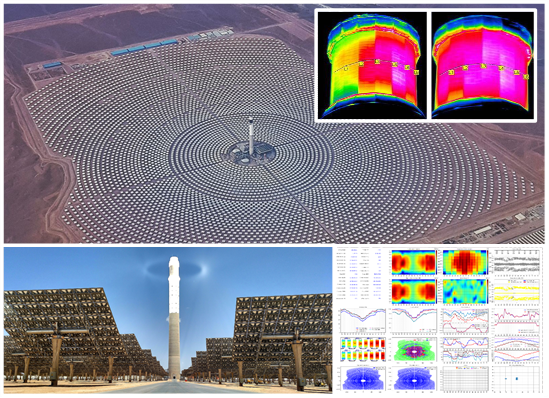
Image 9.- Aerial view of a tower concentration plant developed by Sener (Source: Sener)
This shows that once a sector like the solar photovoltaic sector stabilises, specialised tools are required to capture more value and increase the assets’ profitability. In this case, a team in Sener’s Aerospace division has developed the software required to simulate the performance of this type of plants and has tested and implemented the solar farm’s control logic, a major technical challenge that is much more complex than in any photovoltaic plant. Thanks to years of knowledge, an extremely accurate software was developed that simulated the SENSOL® tower concentration plants, which would eventually become the precursor of ORUGA®, which I have highlighted during the analysis. As decarbonisation gradually materialises, the renewable electron will become a fundamental part of human beings being able to live a more sustainable life in harmony with the environment. Meanwhile, in the coming years, photovoltaic solar power will continue to be installed in Spain at a similar rate to 2023. However, it will be increasingly critical to actively manage the parks in the portfolio in order to optimise performance. Because, in a world like the present, with so many uncertainties, one thing is certain, the sun rises every day.
- ORUGA
- Solar Energy
Tags:
Ager Prieto
Process engineer at Sener's Energy Technology Solutions Hub with over eight years of experience. He is currently involved in the technological development of anionic electrolysis within the IPCEI (International Energy Programme), for which Sener was awarded the contract. He also has experience participating in the project, commissioning, and optimization of the 2.5 MW electrolyzer at the Petronor refinery. He also co-creates the "Energy Analysis" channel on Substack, where he conducts strategic analyses of the energy sector.

